hWeekly
Blood Reports To view and/or print a weekly
blood report showing the week’s glucose levels in bar chart format for
up to five daily periods, first choose any day of the week you want to
view/print from the interactive calendar on the main page. Then select
the “Weekly Blood Report” option from the Tools menu. You will be asked
to choose up to five time periods to display in the report in the configuration
dialog box. Click the radio button in front of the desired times for each
of the five columns of radio buttons. Choose whether you want to display
the report in color (inkjet or laser printer) or black and white (laser
printer - best quality). Click the “Submit” button. The report will be
displayed. The report shows a bar graph for each time period chosen. The
range shadings (good, OK , poor) displayed are customized for the patient
settings. To print the report, click the “Print” button on the report
page. The second illustration shows a sample Weekly Blood Report. Since
a maximum of five times can be shown on one page, you may want to re-configure
and printer several different reports for a given week.
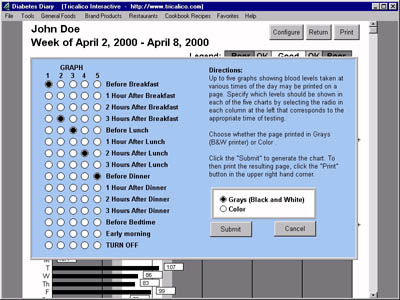
The Weekly Blood Report can be configured to choose
five time periods to be displayed in the report. The report can be displayed/printed
in either color or black-and-white..